
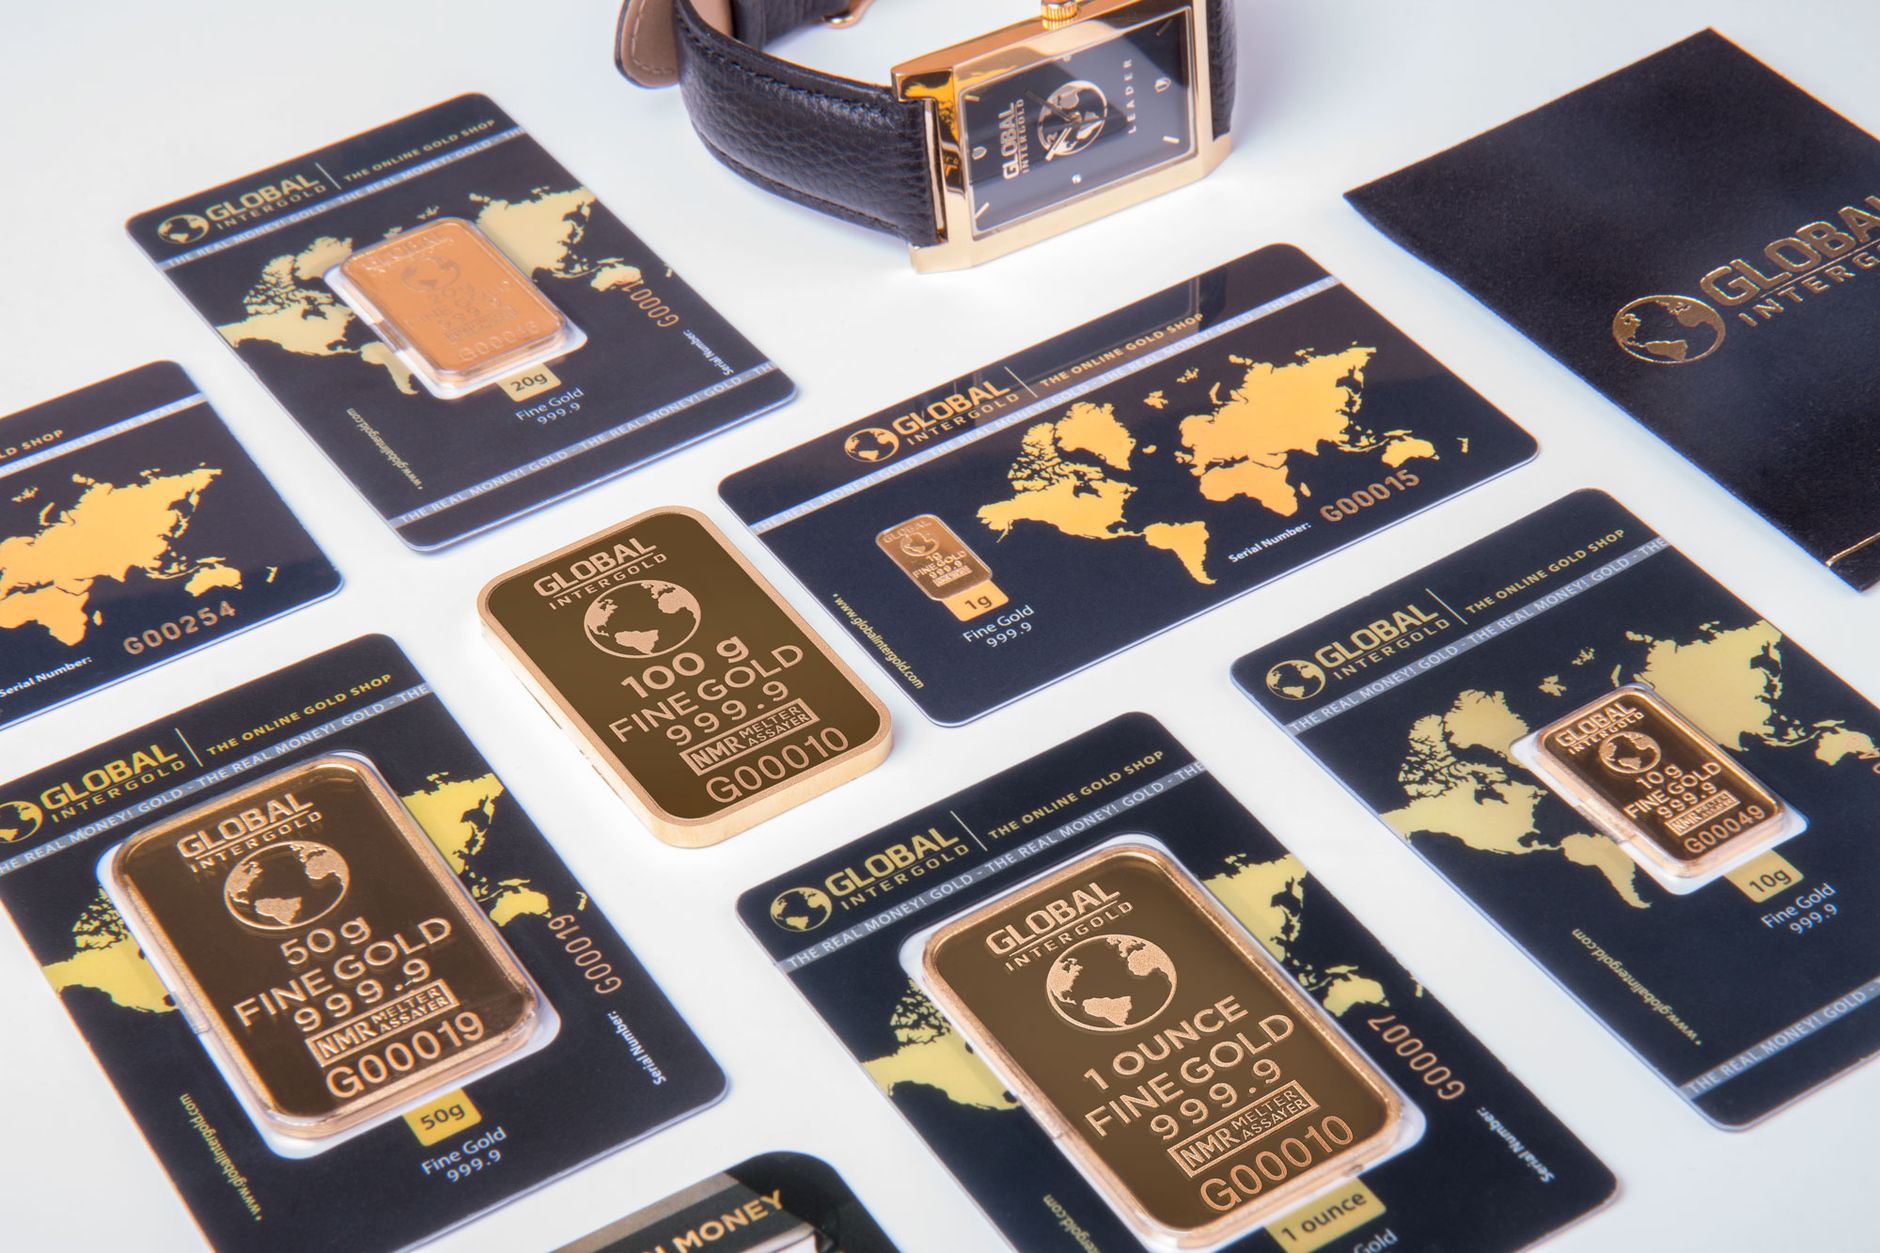
Industrial demand will not drive the next silver rally in 2026. In fact, industrial consumption is forecast to decline 3 percent to 639.6 million ounces this year as manufacturers respond to elevated prices through cost-cutting and material substitution—a process known as silver thrifting. The real drivers of price momentum are a structural supply deficit now in its sixth consecutive year and strong investment demand from both retail and institutional investors seeking protection against currency devaluation. Silver reached an all-time high of $121.62 per ounce on January 29, 2026, before retreating to a $57–$89 range during the second quarter, with J.P. Morgan Global Research forecasting an average price of $81 per ounce for the full year.
The disconnect between the title’s premise and market reality reveals an important lesson about commodity markets: falling industrial demand does not necessarily precede falling prices when supply is constrained and investors are accumulating metal. The solar photovoltaic industry provides the starkest example. Despite a 15 percent expansion in global solar capacity, manufacturers reduced silver consumption by 19 percent in 2026 to approximately 151 million ounces through thrifting techniques and improved efficiency. Yet this industrial pullback has done nothing to brake the bull market in silver. Understanding 2026’s silver outlook requires looking beyond industrial demand to the supply-side crisis unfolding behind the scenes.
Table of Contents
- Why Is Industrial Demand Falling When Silver Prices Are Rising?
- The Supply Deficit—A Structural Problem Driving Prices Higher
- The Unexpected Tailwind—AI Infrastructure and Data Center Demand
- Price Forecasts and Market Expectations for 2026
- Mine Production Cannot Scale to Close the Gap
- Geopolitical Concentration and Supply Risk
- Investment Demand Emerges as the Dominant Price Driver
- Frequently Asked Questions
Why Is Industrial Demand Falling When Silver Prices Are Rising?
The decline in industrial silver consumption runs counter to conventional commodity economics, where rising prices typically reduce demand. However, the relationship breaks down when industrial users face a choice between absorbing higher costs or redesigning their products to use less silver. Electronics manufacturers, which consume 300–310 million ounces annually and represent the largest industrial end-use segment, have begun implementing this optimization strategy. Similarly, the solar industry’s 19 percent reduction in silver per watt of installed capacity—achieved through thinner contact fingers and lower silver paste density in cells—demonstrates how engineering innovation can decouple rising prices from rising consumption.
This thrifting dynamic will likely intensify if silver prices remain elevated. A manufacturer facing a 50 percent price increase year-over-year has financial incentive to invest in redesign efforts that might reduce silver intensity by 10–15 percent, lowering material costs enough to offset the R&D expense. The constraint is time; thrifting campaigns typically require 18–36 months to implement at scale, meaning 2026’s consumption figures largely reflect design choices made in 2024–2025. The three percent decline forecast for 2026 may therefore accelerate in 2027–2028 if manufacturers who have delayed thrifting efforts finally execute their plans.
The Supply Deficit—A Structural Problem Driving Prices Higher
What the falling industrial demand obscures is a deepening supply crisis. The global silver market is forecasted to run a deficit of 46.3 million ounces in 2026, representing a 15 percent deterioration from the 40.3 million-ounce deficit in 2025. More alarmingly, the cumulative drawdown of above-ground silver stocks since 2021 has reached 762.1 million ounces—metal pulled from vaults, ETF holdings, and refinery stocks to cover the gap between annual production and demand. This depletion is not theoretical; it has reduced the global buffer of readily available silver to levels last seen in the 1990s. Mine production constraints explain much of this tightness.
Global silver output is projected to remain flat at 820–830 million ounces in 2026, down from a peak of 900 million ounces in 2016. The fundamental limitation is that approximately 75 percent of mined silver is a byproduct of mining other metals—primarily copper, zinc, and gold. Primary silver mining, where silver is the main target, accounts for only 25 percent of output and has minimal room to expand. This structural dependency means that a copper mine closure in Peru or a gold project delay in Russia directly constrains global silver supply, regardless of silver prices. new mining projects require 7–15 years from discovery to production, and environmental permitting delays routinely add another 3–7 years to development timelines.
The Unexpected Tailwind—AI Infrastructure and Data Center Demand
Within the broader decline in industrial demand sits a surprising growth segment: data center and artificial intelligence infrastructure. Silver demand from hyperscale data centers is growing at 15–25 percent annually and is forecast to represent 20–30 million ounces of incremental consumption in 2026. Silver’s thermal conductivity and electrical properties make it essential for GPU and TPU mounting, thermal interface materials, and power distribution systems in high-performance semiconductors used in AI training and inference workloads. Amazon, Microsoft, Alphabet, and Meta have guided toward $725 billion in combined capital spending in 2026—up 77 percent from 2025—with the majority flowing to AI data center buildout.
This growth is real but remains modest in the context of total industrial demand. The 25 million ounces of data center silver consumption represents less than 4 percent of total industrial usage, meaning the AI boom is adding only marginal volume to offset the broader decline in electronics and photovoltaic demand. Nevertheless, the data center segment is one of the few industrial end-uses growing in absolute terms and will likely accelerate beyond 2026 as AI compute intensity continues to rise. For investors and analysts tracking silver’s fundamental story, AI infrastructure represents the sole bright spot in an otherwise contracting industrial demand picture.
Price Forecasts and Market Expectations for 2026
J.P. Morgan Global Research projects that silver will average $81 per ounce across 2026, more than double the $37 average price in 2025. A February 2026 Reuters poll of metals dealers and analysts converged on a forecast of $79.50 per ounce for the year. These consensus forecasts rest on the assumption that the supply deficit will persist and that investment demand will remain robust, but they also imply volatility. Silver’s retreat from the all-time high of $121.62 per ounce on January 29 to the $57–$89 range in the second quarter of 2026 suggests that even bullish investors have limits.
The 35 percent decline from the peak reflects profit-taking, technical resistance at round numbers, and periodic loss of confidence in the sustainability of the bull case. The price divergence between the peak and the Q2 trading range creates a practical challenge for portfolio managers and retail investors. A position opened in late January at $115 per ounce is underwater at Q2 prices, raising questions about conviction and stop-loss discipline. Conversely, investors who waited for the pullback to $75 per ounce secured a more favorable entry point with greater risk-reward geometry. The historical pattern in silver suggests that peaks and troughs are often separated by 12–18 months, meaning the all-time high reached in January 2026 may not be revisited until 2027–2028 if the current correction follows typical proportions.
Mine Production Cannot Scale to Close the Gap
The supply deficit cannot be resolved by ramping mine output, at least not within the timeframe of 2026–2027. The primary constraint is the byproduct nature of silver mining. If a copper mine in Peru is operating at full capacity and producing 850,000 tonnes of copper annually, the silver yield is effectively locked by the copper ore grade and metallurgical recovery. Expanding silver output from that mine would require mining additional ore and processing it specifically for silver recovery—a capital-intensive undertaking that few operations pursue.
A warning sign for investors betting on high silver prices is the risk of input cost inflation: if mining companies invest in primary silver extraction to capitalize on higher silver prices, they will increase production costs and may require $60–$70 per ounce to justify the investment. The 7–15 year development timeline for new mining projects means that no meaningful new supply is likely to reach the market before 2032–2035, even if projects are greenlit today. Environmental permitting in jurisdictions like Argentina, Chile, Canada, and Australia has become more stringent, pushing timelines toward the upper end of this range and increasing regulatory risk for project developers. The Silver Institute’s forecast assumes no major new mining projects reaching production by 2028, and the track record of permitting delays supports this assumption. For investors with a three–to–five year horizon, mine supply constraints should be viewed as a structural tailwind supporting prices.
Geopolitical Concentration and Supply Risk
Mexico, Peru, and Russia collectively account for over 40 percent of global silver mine production, creating substantial geopolitical concentration risk. A major operational disruption—labor strife, environmental accident, or regulatory change—in any of these countries could contract global supply by millions of ounces within months. The risk is not theoretical: labor disputes in Peru have shuttered major mining operations for weeks at a time, and political instability in Mexico has periodically disrupted production. China, the world’s second-largest silver producer, added silver to its critical minerals list in October 2025 and introduced new export regulations that could restrict the flow of Chinese-produced silver to international markets if Beijing prioritizes domestic supply security.
The China development is particularly significant because it signals a shift toward treating silver as a strategically important commodity alongside rare earth elements and gallium. Export quotas, licensing requirements, or outright bans on Chinese silver exports could remove 50–80 million ounces from global supply chains over time. Multinational companies sourcing silver for electronics or solar manufacturing may be forced to diversify suppliers or accept higher prices as Chinese material becomes unavailable. For investors, the geopolitical dimension of silver supply adds a tail risk to the bullish case but also reinforces the structural supply tightness that supports higher prices.
Investment Demand Emerges as the Dominant Price Driver
Investment demand—including purchases of silver bars, coins, and ETFs by retail and institutional investors—has become the primary price driver in 2026, offsetting the decline in industrial consumption and filling the structural supply gap. When industrial users reduce purchases by 3 percent and mine production is flat, investment demand must increase by millions of ounces simply to prevent inventory depletion and price spikes that would trigger physical supply rationing.
Data from major silver ETFs shows record inflows during the January rally and significant purchasing during the Q2 pullback, suggesting that investors view silver as an undervalued store of value relative to equities and bonds. The Silver Institute’s forecast for 2026 assumes that investment demand will remain “strong,” without providing a specific volume estimate, but the mathematics are clear: with industrial demand at 639.6 million ounces and jewelry and silverware demand stable at approximately 170 million ounces, investment demand must account for approximately 390–400 million ounces—nearly 50 percent of total supply—to balance the market against the 46.3 million-ounce deficit and above-ground stock drawdown. This level of investment purchasing is substantially higher than historical norms and indicates that investment money is the primary force supporting prices, not industrial growth or consumption patterns.
Frequently Asked Questions
If industrial demand for silver is declining, why are prices so high?
Prices are high because the market is running a structural supply deficit in its sixth consecutive year. Investment demand from retail and institutional investors is offsetting weak industrial consumption, and above-ground stocks are being drawn down to cover the gap. Mine production cannot expand quickly enough to close the deficit.
Will the solar industry’s switch to silver-efficient cell designs accelerate silver thrifting across other industries?
Yes. The solar industry’s 19% reduction in silver use per watt, achieved through thinner contact fingers and more efficient paste formulations, will likely be replicated in electronics and other applications. Manufacturers facing sustained high prices typically fund thrifting R&D, which typically takes 18–36 months to implement at scale.
How much of the 2026 rally is driven by AI infrastructure demand?
AI infrastructure is the lone bright spot, with data center demand growing 15–25% annually. However, it represents only 20–30 million ounces of incremental demand against a total industrial market of 639.6 million ounces—less than 4% of industrial consumption. The bulk of price gains are driven by supply constraints and investment demand, not industrial growth.
Is $81/oz per annum sustainable if the supply deficit persists?
Sustainability depends on investment demand remaining robust. If institutional or retail investors reduce purchases and industrial demand continues to decline through thrifting, prices could fall toward $60–$65/oz. Conversely, if geopolitical disruption constrains mine output or China restricts silver exports, prices could spike above $100/oz again.
Why can’t new mining projects close the supply gap by 2027 or 2028?
New mining projects take 7–15 years from discovery to production, with environmental permitting adding 3–7 additional years. Additionally, 75% of mined silver is a byproduct of copper, zinc, and gold mining, so output is constrained by demand for these other metals. No major new silver projects are forecast to reach production before 2032–2035.
What is the geopolitical risk to silver supply in 2026?
Mexico, Peru, and Russia account for over 40% of production. China, the second-largest producer, added silver to its critical minerals list in October 2025 and introduced export regulations that could restrict supply. A major disruption in any of these countries could contract global supply by millions of ounces and spike prices.